6 Ways to Create Better Salesforce Reports
Do you want to learn to create better Salesforce reports? Even though businesses today collect a wealth of data, it’s difficult to make use of all that information. Almost half (48%) of all employees say that they’re forced to use data that isn’t customized for their use.
If you want your employees to make the best use of the data available, you need to create better reports. Read on to learn how.
Understanding the Different Types of Salesforce Reports
By providing a variety of customization options, Salesforce lets users create an almost limitless number of reports. All of these reports, however, are built from the records and fields of the data your business collects, and can be grouped into four general types:
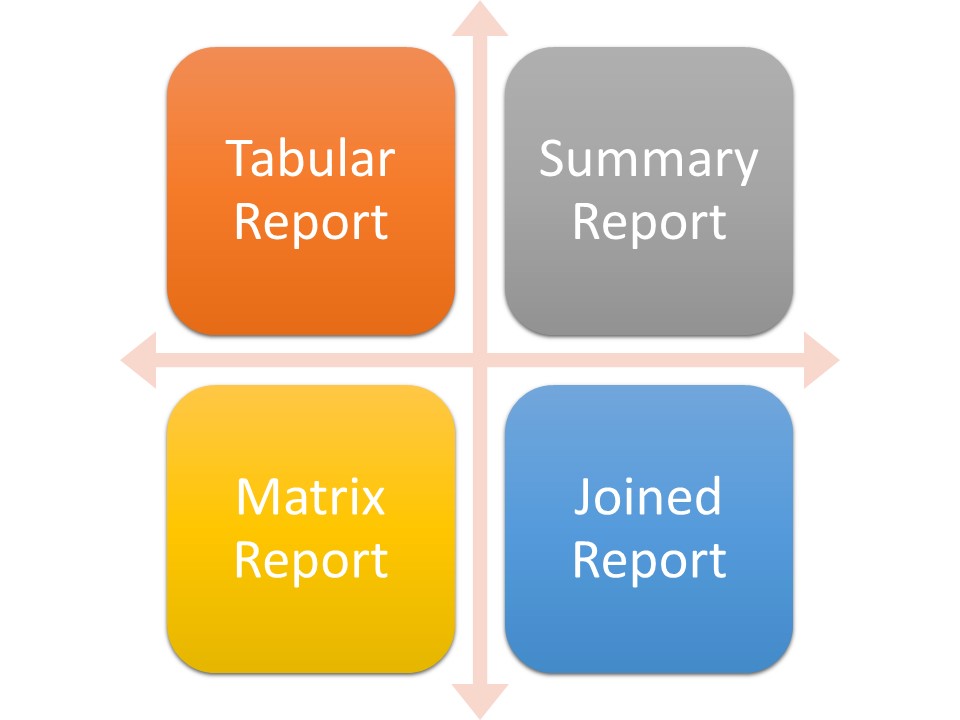
- Tabular report, which presents data in rows and columns, like a spreadsheet
- Summary report— similar to a Tabular report— enables you to group rows of data, calculate totals for those groups, and create visual chart
- Matrix report, which enables data to be grouped by both rows and columns
- Joined report, which lets you create different data views from multiple report types, side by side
The simplest report format – and Salesforce’s default – is the Tabular report. This format may not always be the most effective, however.
How to Create a Report in Salesforce
Creating a report in Salesforce is a relatively easy process with plenty of opportunities for customization. Follow these steps:
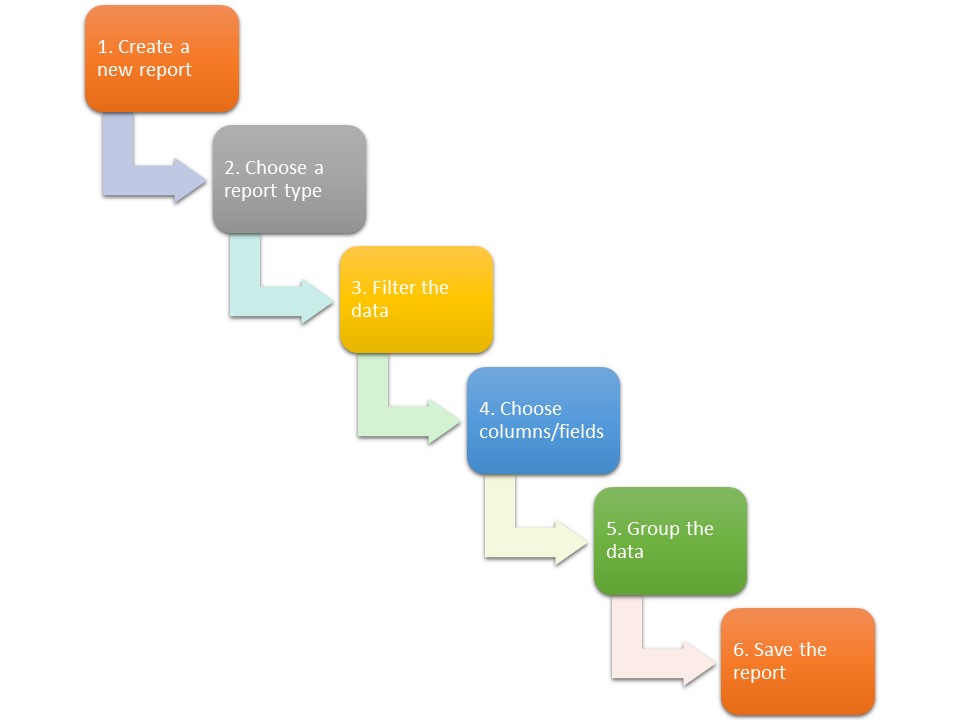
- Create a new report by clicking the New Report button in the console
- Choose a report type (accounts and contacts, opportunities, leads, campaigns, etc.)
- Filter the data to define the scope of the report
- Choose the columns and fields you want to display (and name them appropriately)
- Group your data by the relevant date or field
- Save the report and give the report a unique name
The following video shows how to create a Salesforce report in more detail.
How to Create Better Salesforce Reports
As you can see, it’s easy to create a basic report in Salesforce. What’s more difficult is creating a report that includes just the data you need, provides actionable insights, and is easy for others to understand. With that in mind, here is what you can do to create better Salesforce reports.
1. Know What Others are Looking For
In order to choose the right report types, you need to know what your audience is looking for. Determine your audience and then find out what questions they’re asking. Ask what metrics are most important to your audience and what results they want to drive. Only when you know who your audience is and what information they need can you build a report that answers their questions.
When building a Salesforce report, you also need to keep in mind your company’s vision and business objectives. If driving big deals is important to your strategy, report those metrics that track deal size. If improving marketing effectiveness is a goal, then track metrics related to awareness, response rates, and the like. Give your audience what they’re looking for and what helps you achieve your business goals.
2. Don’t Create Too Many Reports
When you’re working with Salesforce, it’s tempting to keep churning out a large number of reports tracking every conceivable metric and combination of metrics. Just because you can do this doesn’t mean you should to this, however. Inundating management with a never-ending stream of reports is overwhelming and ultimately counterproductive. If nothing else, generating too many reports reduces productivity – not just yours, but for anyone who has to read all those reports. Focus on fewer, more impactful reports instead and you’ll get better results.
3. Develop a Clear Naming Strategy
Every report you create should be named in a way that clearly identifies what the report is about to anyone reading it. If you receive a report with the generic label “Sales Report” you won’t have any idea what’s actually in the report. But if that report was labeled “Revenues by Channel Fiscal Year 2020,” you know exactly what’s covered and whether you’re interested in it. You should follow this unambiguous naming strategy for the individual fields and rows and columns in each report.
4. Present Information in a Structured Format
Raw data is nothing more than gibberish to anyone accessing a report. You need to structure your information in a way that makes sense to everyone reading the report. Use Summary or Matrix report formats to group the data in a logical fashion. Make it easy for users to extract the relevant information – don’t make them hunt for what they need.
5. Remove Distracting Clutter
Along the same lines, don’t clutter your reports with data that isn’t straight to the point. If a particular metric is interesting but not relevant to the task at hand, don’t include it. Too much information overwhelms and distracts the readers. Let the data you elect to include work to make a clear and concise point. When it comes to effective reporting, less is more.
6. Use Data to Drive Results
Finally, design your Salesforce reports so that management can clearly determine the right path to success. The reality is that too many reports today go unread or unused because they don’t have a specific point of view. Present relevant data that helps your audience make better decisions. Research shows that companies that embrace data-driven decision-making are three times more likely to make better decisions – and 19 times more likely to be profitable.
Bonus Tip: Let Rainmaker Help You Create Better Salesforce Reports
When you want to create the most effective reports for your organization, turn to the Salesforce experts at Rainmaker. We can help you create dashboards and reports that give your management the information they need in easily understandable fashion. We also offer a wide variety of Salesforce Managed Services that help your company use your data to drive revenue and profits – and ensure that your business grows over time.
Contact Rainmaker today to learn more about creating better reports in Salesforce!
Related Resources

Navigating Vendor Complexity with Ease: How ResellerOS Makes Multivendor Management a Breeze
Navigating Vendor Complexity with Ease: How ResellerOS Makes Multivendor Management a Breeze The Multivendor Maze In the world of IT reselling, managing multiple vendor relationships can often feel like navigating a complex maze

4 Things to Do with Your Salesforce Customer Data
4 Things to Do with Your Salesforce Customer Data In John Krakauer’s book Into the Wild, he recounts the true story of Chris McCandless, a college student-turned-nomad who abandons civilized life to live in

4 Trends that Predict the Future of CRM
4 Trends that Predict the Future of CRM Commerce is virtually as old as time, but the last few decades, in particular, have seen a dramatic increase in the speed at which business evolves.

How to Determine the Value of Your Ad Inventory
How to Determine the Value of Your Ad Inventory Car dealerships do lot checks to calculate the value of their car inventory, and banks do audits to calculate the value of their cash inventory,

The Complete Guide to Salesforce App Building
The Complete Guide to Salesforce App Building When you hear “app building,” what’s the first image that comes to mind? Caffeine-fueled programmers working around the clock to pump out tens of

Salesforce Advertising Studio: Powering Data-Driven Advertising
Salesforce Advertising Studio: Powering Data-Driven Advertising What do you think of when you read the word “whassup”? Today, the Budweiser “whassup” campaign is old enough to drink. Despite being over 22 years old, Budweiser’s