5 Salesforce Reporting Best Practices
When tracking your sales and marketing efforts, access to hard figures and real-time updates have a direct impact on performance. Without being overly dramatic, each bit of information may influence how your team adjusts and evolves every day. Staying up-to-date with Salesforce reporting best practices ensures you’re doing everything you can to keep your team in the know on what’s working, what’s not, and how to improve on performance.
Using these insights, you’ll be able to adjust your strategy with actionable data when you identify new growth opportunities. Salesforce reporting tools allow you to visualize information and keep your teams working toward their targets, even building personalized dashboards when required. According to 360quadrants, Salesforce continuously upgrades and adapts their products according to user demand, allowing them to remain a visionary leader in the CRM space.
Today, Salesforce remains the go-to standard solution for all sales, marketing, and customer service operations in organizations. What the platform offers customers is the ability to set achievable targets, measure performance against these goals, and adjust strategy accordingly whenever the situation changes.
2021 Top 5 Salesforce Reporting Best Practices
Reports and dashboards in Salesforce should be how you answer questions about your biggest business concerns. Reports are a way you can use data to visualize every element of your marketing, sales, or service performance throughout your organization. The platform allows you to aggregate data by time, totals, or any other metric you may decide warrants closer study.
When it comes to answering your business questions, Salesforce reports help to:
- Determine which products were your best sellers over a specific period
- Identify how well-serviced and satisfied your customers were during their interactions
- Learn whether you engaged with any prospects that require an increase of resources to close
- Ensure your marketing campaigns are drawing ideal visitors who will hopefully become loyal customers
When you define your reports and dashboards correctly, Salesforce can become a snapshot of your current business strategy. These reports deliver a version of the truth based on your data, and provide the context required to make informed business decisions.
To help you keep track of all the important information in your business, consider these five Salesforce reporting best practices. If you implement these reporting processes, you can extract meaningful insights from your business data and share that information with your team every day.
1. Be Definitive about Your KPIs
Before you build your reports and dashboards, you’ll need to identify every data point in your process that you want to measure – the more granular, the better. Salesforce allows you to configure your reports according to your unique business KPIs and drill down to the precise level of details you require.
You should consider Salesforce reports that:
- Provide you with your top pipeline prospects and customers
- Examine close ratios by month or quarter, or whatever cycle you use in operations
- Show real-time sales performances versus targets
- Offer charts that track each prospect through your company’s customer journey
With Salesforce, you can collect and consolidate data from multiple sources to provide insights into your marketing and sales tasks, or to maintain accurate forecasts about your daily operations. Reports in Salesforce make your life easier while helping to keep your entire team working toward the same goals.
2. Include Additional Context with Your Data and Charts
To help staff make better decisions quickly, you should include additional details with the numbers you collect and collate in your reports. If someone wants to delve deeper into the figures, you can use the features in Lightning reports that allow staff to drill down to the specific deals that make up the numbers.
You can also add text comments and calculation breakdowns, or just limit the display to a smaller group of data with the option to navigate deeper if required. The reports could start by focusing on types, owners, stages, and amounts, with each having more detailed information available in the background.
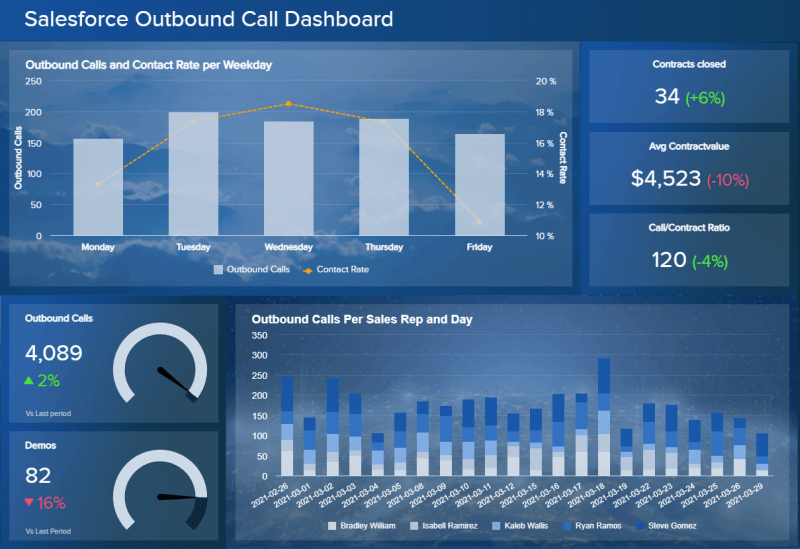
Source: https://www.datapine.com/blog/salesforce-reports-examples-and-templates/
3. Sanitize All Your Data Used in Your Reports and Dashboards
Any data analyst will tell you that the output of your report is only as accurate and complete as the source. Cleaning your data and ensuring all your sources have sanitized information may be one of the most important steps when defining and implementing new Salesforce reports.
You should eliminate all duplicate data, track the users who update relevant fields, and you may even want to build in data validation rules to help keep your reports clear and insightful. Standardize your data formats and types, establish input rules, and develop a process for identifying and removing bad data from the system. If you have a lot of data cleanup to do, consider a platform such as DemandTools or Ringlead; our preferred tools.
4. Continuously Revise and Improve Your Reports
Your end-users will let you know when a report isn’t exactly serving their needs or where you can improve the reporting process. When you get feedback, consider how you can enhance your reports while remaining aligned with the company’s vision. Not all the data you collect, transform, and present to staff will be equally valuable. Different teams will have unique needs. And sometimes architectural changes will be needed to provide newly-discovered KPI measurements.
To ensure your reports and dashboards are having the right effect, you should:
- Set goals from the top down and empower team leaders to define their own reporting criteria
- Define data quality requirements and establish separate metrics for management performance
- Capture and analyze user information to understand what your staff and customers are experiencing during interactions
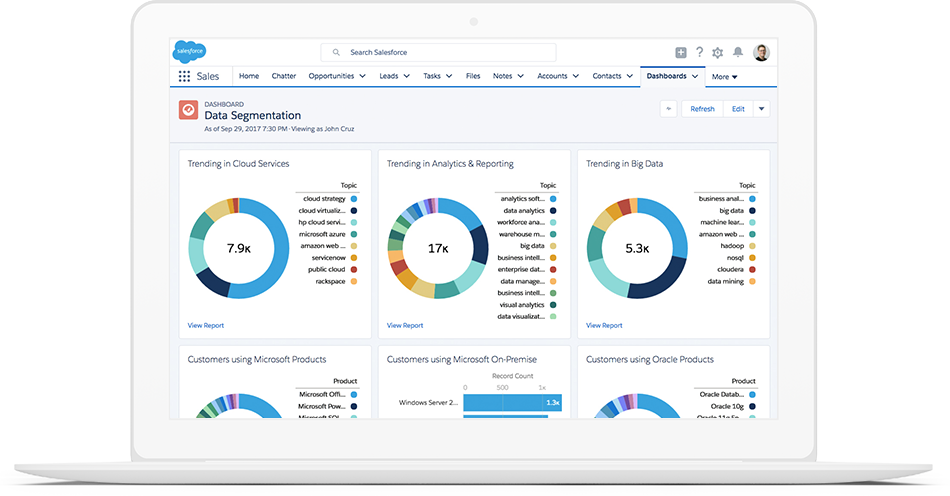
Source: https://www.salesforce.com/products/data/overview/
5. Take a Data Science Approach to Salesforce Reporting
Asking the right business questions requires you to format, sanitize, and stage data that can provide the answers and help solve immediate challenges. Making intelligent decisions starts with choosing the right sources and loaders to filter what you collect in the context of the problem you’re trying to solve. You’ll need to leverage data science tools like machine learning, while also establishing the right use cases, to get the most out of your business data.
You can only report on the information that you collect, making your initial report and dashboard definitions a key step in the process. Start with fewer data and only add additional sources as or when it becomes required. With Salesforce, you can continue to build on your capabilities by developing new reports and optimizing your visualizations to include additional context where necessary.
Adding new apps to your Salesforce ecosystem will also generate new data, and you’ll need to determine how best you can use this information to drive performance.
Implementing Salesforce Reports and Dashboards that Drive Business Intelligence
If you develop and deploy your Salesforce reports and dashboards correctly, you can keep your teams on track by using accurate data for every task. Rainmaker assists organizations who want to make the most out of their Salesforce implementation and generate actionable insights for improved business intelligence.